Higher-order nonlinear dielectric microscopy detects the signal corresponding to the higher-order nonlinear dielectric constant ε(4),ε(5),ε(6)... (4th, 5th, 6th... rank tensor nonlinear dielectric constant, respectively), which is difference from the conventional SNDM technique which measure the lowest-order nonlinear dielectric constant ε(3) (3rd rank tensor nonlinear dielectric constant).
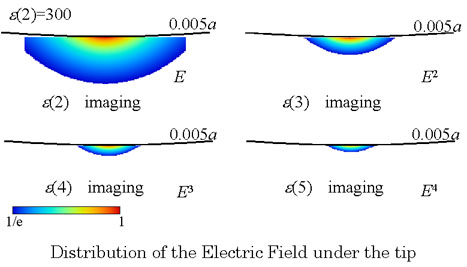
The resolution and the depth sensitivity of SNDM depend on the distribution of the electric field under the needle tip.
These figures show the effective region of the electric field of each order of the dielectric constant measurement. (Thus, these figures show the resolution and depth sensitivity of SNDM.) In this figure, a shows the tip radius and we normalized the coordinate by tip radius a.
From these figures, we find that the higher-order nonlinear dielectric imaging has higher resolution and sensitivity in shallower area from surface than lower-order nonlinear dielectric imaging, because the distribution of electric field becomes much concentrated in accordance with their power.
(If you want to know the resolution and depth sensitivity of SNDM in detail, please check the publication.)
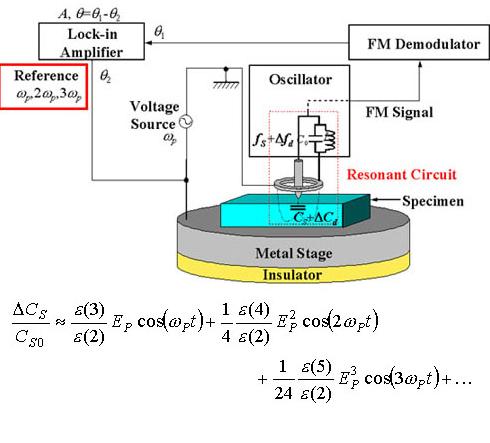
This figure shows the system diagram of SNDM. In this figure, equation shows the relationship between the capacitance (which is measured by SNDM) and the nonlinear dielectric constant. From this equation, we focused on detecting the signals corresponding to ε(3),ε(4) and ε(5) at frequency ωp of applied electric field, doubled frequency 2ωp and teipled frequency 3ωp, respectively.
Thus, for measuring the higher-order nonlinear dielectric constant, we only change the frequency of the reference signal of the Lock-in Amplifier on the conventional SNDM system.
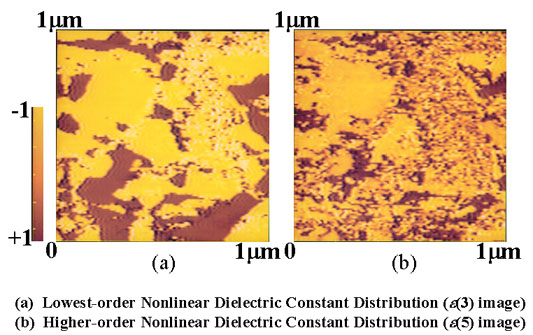
This figure shows the ε(3) and ε(5) images of PZT thin film. Higher order nonlinear dielectric image shows the polarization distribution in detail than conventional SNDM image.

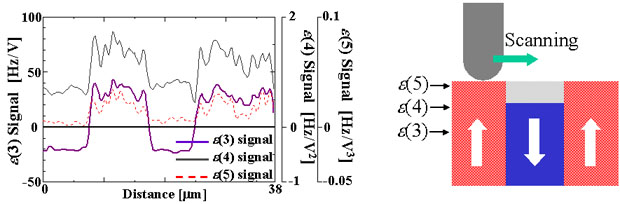
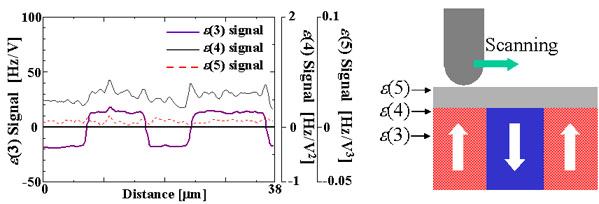
Figure(a) shows the ε(3),ε(4),ε(5) image of the unpolished virgin Periodically Poled LiNbO3(PPLN). (Figure(b) shows the model of this measuring. In this figure, the arrows show the depth sensitivity of ε(3),ε(4),ε(5) imaging.)
In this figure, ε(3) imaging detects the clear c-c domain boundary, whereas ε(5) imaging cannot detect the SNDM signal. This implies that the paraelectric surface layer exists on the LiNbO3 and ε(5) imaging detects the signal of this layer.
Then, to prove the existence of surface paraelectric layer, we polished this PPLN.
This figure shows the ε(3),ε(4),ε(5) image of polished PPLN. In this figure, ε(5) imaging can detect the c-c domain boundary after removal of the surface layer. Moreover, ε(4) imaging can also periodic signals, in contrast to our expectation. This phenomenon that the nonlinear dielectric signals of a positive area of PPLN are stronger than those of a negative area immediately after polishing can be interpreted as that the negative area is more easily damaged than positive area and has already been covered by a very thin surface layer with weak nonlinearrity.
1 hour after polishing, we measure the ε(3),ε(4),ε(5) signal of PPLN again. In this figure, the ε(5) signal disappears and ε(4) signal becomes flat again, whereas ε(3) imaging clearly detects the c-c domain boundary. This implies that the entire surface area of PPLN covered by the surface layer again.